Dissemination activities

Researchers do not only communicate through journals, books, and other scientific publications. They also inform the public about their work, its importance, and their findings. Effective communication can foster support and understanding for science, highlight its broader societal relevance, and pave the way for informed decision-making.

Every project we support is required to create a communication plan, and they all report on their communication efforts. These reports detail the methods used, primary target audiences, outcomes, and reach.

Dissemination activities by type
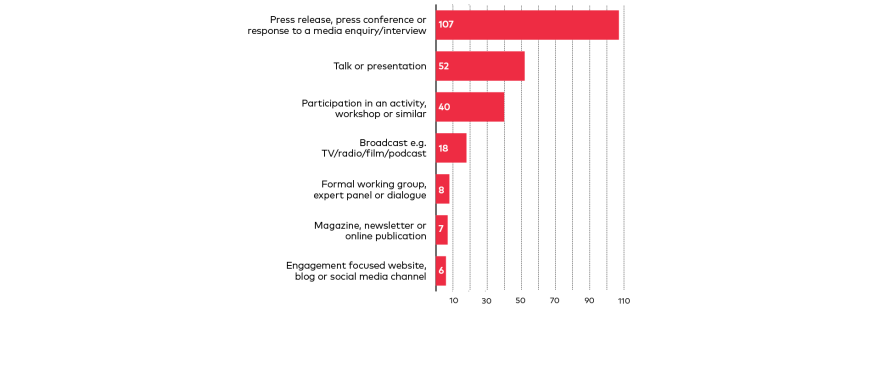
A bar chart titled 'Dissemination activities by type'. The chart displays various types of dissemination activities and their respective counts:

'Press release, press conference or response to a media enquiry/interview' with a count of 107.
'Talk or presentation' with a count of 52.
'Participation in an activity, workshop or similar' with a count of 40.
'Broadcast e.g. TV/radio/film/podcast' with a count of 18.
'Formal working group, expert panel or dialogue' with a count of 8.
'Magazine, newsletter or online publication' with a count of 7.
'Engagement focused website, blog or social media channel' with a count of 6.
A vertical axis on the right indicates the range of counts from 10 to 110.

Dissemination activities by geographical reach
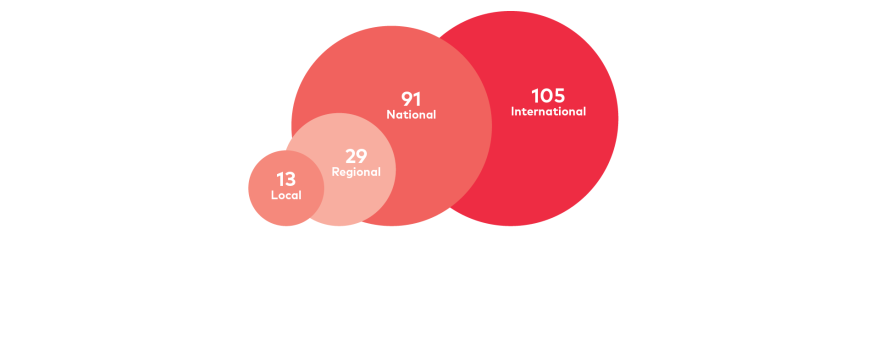
A bubble chart titled 'Dissemination activities by geographical reach'. The chart displays three circles (bubbles) of varying sizes representing different geographical levels of dissemination:

'International' with a count of 105 is represented by the largest red bubble.
'National' with a count of 91 is represented by a medium-sized red bubble.
'Regional' with a count of 29 is represented by a smaller peach-colored bubble.
'Local' with a count of 13 is represented by the smallest peach-colored bubble.
The size of each bubble corresponds to the count of dissemination activities at that specific geographical level

Dissemination activities by primary audience
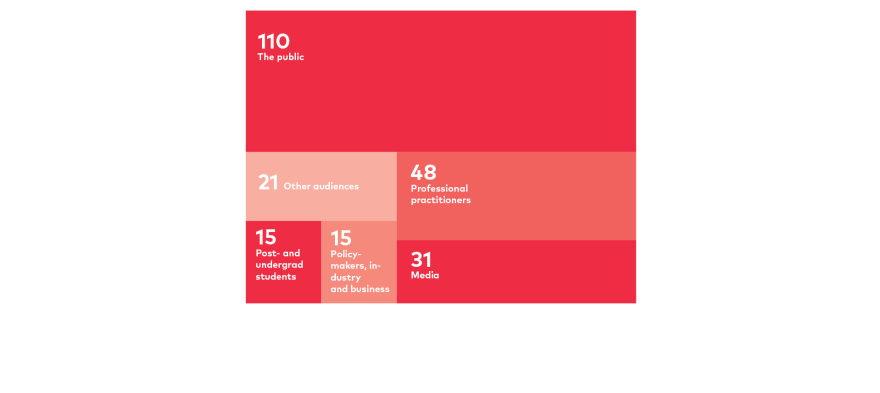
A visual representation titled 'Dissemination activities by primary audience'. The visualization showcases the count of dissemination activities targeted towards different primary audiences, illustrated in various sized boxes based on the number of activities:

'The public' with a count of 110 is represented by the largest red box.
'Professional practitioners' with a count of 48 is represented by a medium-sized red box.
'Media' with a count of 31 is represented by a smaller peach-colored box.
'Other audiences' with a count of 21 is represented by a similarly sized peach-colored box as 'Media'.
'Post- and undergrad students' with a count of 15 is represented by a smaller peach-colored box.
'Policy-makers, industry and business' with a count of 15 is represented by another similarly sized peach-colored box.
Each audience group is paired with its respective count, and the size of each box indicates the prominence of that audience group in the dissemination activities.